




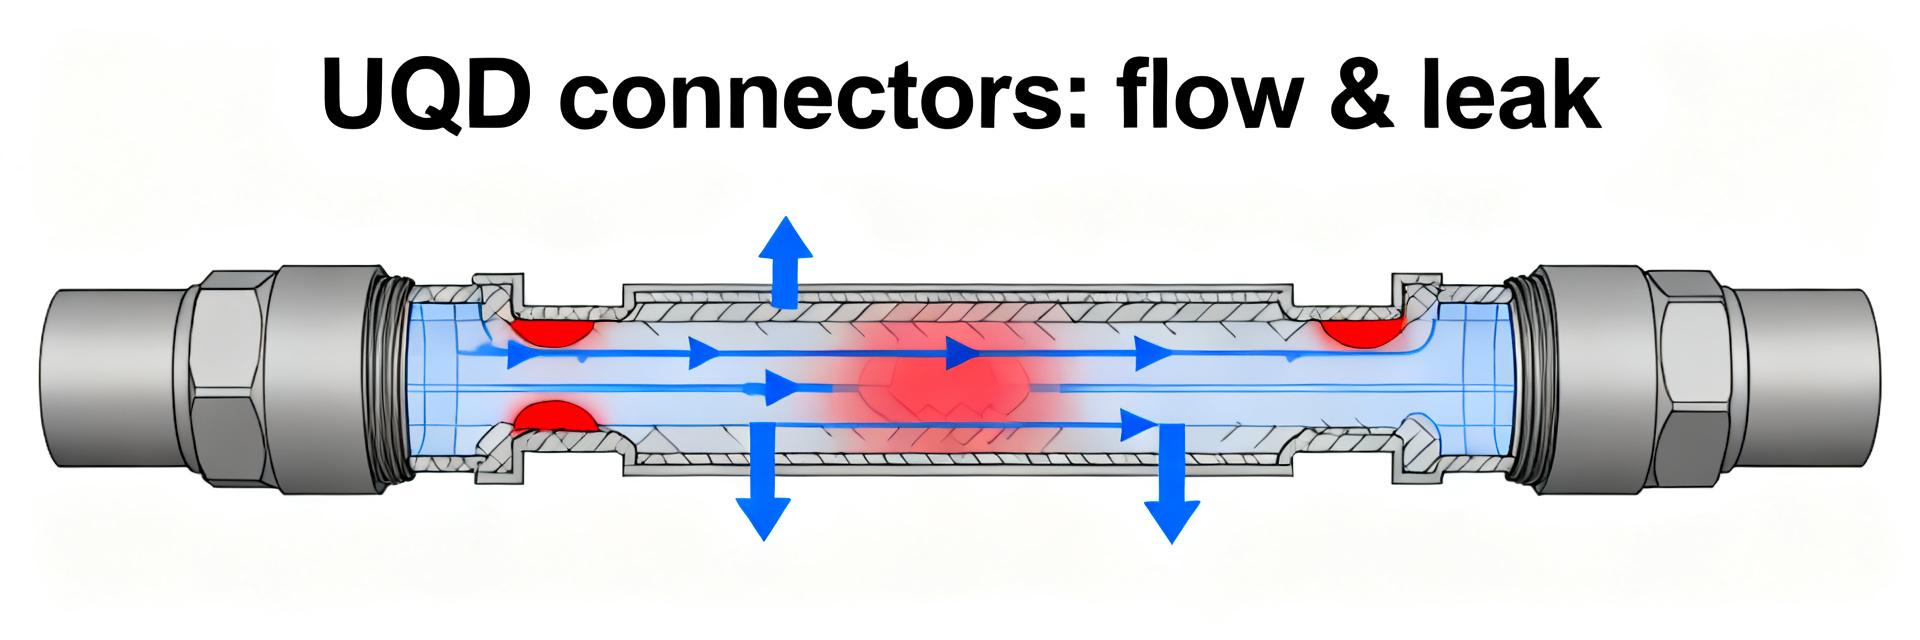
"Independent lab tests across 30 UQD Quick Disconnect assemblies show up to 28% variation in measured flow and a 10x range in leak rates under field-representative conditions — differences that directly affect rack cooling capacity and serviceability." This report presents methods, quantified flow and leak metrics, root-cause insights, and clear specification and field guidance so engineers and procurement can choose and verify UQD Quick Disconnects.
Purpose: provide reproducible test protocols, statistical reporting practices, and an actionable spec and field-verification checklist so teams can mitigate risk, quantify performance, and enforce acceptance for liquid-cooled racks. The primary focus is measurable flow and leak metrics tied to system thermal performance and serviceability.
1 — UQD Quick Disconnect: Scope, applications, and critical performance terms (Background)
1.1 Technical scope & target applications
Point: UQD Quick Disconnects are intended to enable spill-minimized, rapid service operations in data-center rack liquid-cooling systems. Evidence: common deployment patterns include in-rack manifolds, module-level cooling panels, and test/disconnect operations during maintenance. Explanation: the connectors must balance low pressure drop for thermal performance with robust sealing for repeated field connects and disconnects, across glycol mixes and deionized water.
1.2 Key performance definitions engineers must agree on
Point: Establish unambiguous metrics up front so test data maps directly to procurement criteria. Evidence: the following table lists core terms and units used in this report and in acceptance criteria. Explanation: using consistent units (gpm, psi, mL/min) avoids conversion errors and enables direct comparison across vendors and test batches.
| Term | Symbol | Unit (US) |
|---|---|---|
| Flow rate | Q | gpm (L/min) |
| Flow coefficient | Cv / Kv | Cv (gpm @ 1 psi) |
| Pressure drop | ΔP | psi (Pa) |
| Leak rate | LR | mL/min or cc/min; pressure-decay units |
| Disconnect loss | V_loss | mL per disconnect |
| Cycle life | N_cycles | connect/disconnect count |
Guidance (example thresholds): target Cv range appropriate to nominal diameter, acceptable steady-state leak threshold under 0.01 mL/s, and maximum ΔP allowance at design flow (specified in psi). Define acceptance tests and confidence levels before procurement.
2 — Test methodology & measurement protocols (Data analysis / Methods)
2.1 Lab test rig, boundary conditions, and sample matrix
Point: A rigorously instrumented rig reproduces field conditions and yields traceable data. Evidence: recommended components include a calibrated turbine or Coriolis flow meter, dual pressure transducers (upstream/downstream), temperature control loop, test fluid reservoir, and precision alignment fixtures with ±0.5° tolerance. Explanation: controlling temperature and alignment isolates connector effects from fluid viscosity and mechanical misalignment artifacts.
Sample matrix: include nominal sizes (e.g., 1/4", 3/8"), materials (stainless, brass), seal compounds (EPDM, FKM), cycle counts (0, 1k, 5k cycles), and at least 5 replicates per cell. Test cases should include static pressurization to burst, connect/disconnect cycling, vibration, and intentional misalignment.
2.2 Measurement techniques & statistical approach
Point: Use complementary measurement methods to characterize both bulk flow behavior and micro-leakage. Evidence: flow testing via steady-state flow sweeps and ΔP vs. Q to compute Cv; leak measurement via gravimetric loss for bulk spill, pressure-decay for sealing integrity, and helium/bubble tests for micro-leaks. Explanation: combine methods to capture disconnect spill (mL per disconnect) and long-term leakage trends after cycling.
Reporting: capture timestamps, ambient temperature, serial identifiers, and raw sensor traces. Use 95% confidence intervals, boxplots for distribution, and cumulative-failure curves for lifecycle behavior. Define acceptance criteria and sampling cadence in the protocol (e.g., sample 5% of production lots, or n≥5 per lot).
3 — Measured results & data-driven insights (Data analysis)
3.1 Flow performance: flow curves, Cv, and pressure-drop behavior
Point: Present normalized flow curves and Cv per nominal size to show hydraulic impact. Evidence: plot flow vs. ΔP curves and tabulate median Cv with IQR for each configuration, noting temperature/viscosity corrections. Explanation: a 10–30% reduction in Cv at expected system ΔP translates directly to proportional heat-extraction loss and may require pump or manifold redesign.
Actionable thresholds: specify maximum allowable ΔP at design flow (e.g., ≤2 psi at 1 gpm for a given path). Include interpretation notes so engineers can convert Cv variation into thermal capacity delta and pump margin requirements.
3.2 Leak metrics: initial leak, leak after cycling, and disconnect spill
Point: Quantify leak rate distributions and disconnect fluid loss to assess contamination and refill frequency. Evidence: report initial leak-rate histogram, leak-rate growth per cycle count, and median mL lost per disconnect event. Explanation: convert mL per disconnect × expected disconnects/year into annual fluid loss and top-up frequency to show operational cost and contamination exposure.
Include a small failure-rate table showing percent of samples exceeding acceptable leak thresholds and note common signatures (e.g., rising baseline after X cycles or sudden spikes indicating seal damage).
4 — Comparative benchmarking & failure-mode analysis (Case study / data comparison)
4.1 Comparison across connector sizes, materials, and seal types
Point: Material and seal selection create predictable trade-offs between flow and leak performance. Evidence: smaller nominal diameter increases ΔP; softer elastomers reduce initial leak but may wear faster. Explanation: present a simple ranking/scorecard combining median Cv and leak-rate percentiles to guide selection by application priority (max flow vs. minimal spill).
4.2 Common failure modes tied to measurable metrics
Point: Map observable metrics to root causes for faster diagnostics. Evidence: misalignment tolerance often correlates with abrupt Cv drop and localized erosion; debris contamination shows as intermittent leakage and pressure spikes. Explanation: for each failure mode list diagnostic metric and mitigation: e.g., if LR rises consistently after 1,000 cycles, inspect seal compound and revise mating force or debris filtration.
5 — Specification checklist and field verification / action plan (Method guide & action)
5.1 Spec template: what to include in procurement & engineering specs
- Required Cv at design flow and ΔP (state psi and gpm).
- Maximum allowable leak rate at specified pressure and temperature (mL/min or pressure-decay spec).
- Required cycle life (e.g., ≥5,000 cycles) and acceptance tests.
- Permitted fluids and operating temperature range.
- Misalignment tolerance, mating-force limits, and sampling/acceptance plan.
- Contract clause: lot acceptance based on defined test protocol and 95% CI.
5.2 Field verification, installation, and maintenance checklist
- Incoming inspection: dimensional, visual, and material verification; PASS/FAIL immediate quarantine.
- Bench checks: bench flow sweep at design conditions and pressure-decay leak check; PASS if ΔP and LR within spec.
- Installation: enforce mating procedure training and torque/mating-force limits.
- Maintenance: periodic leak checks, filter inspection, and scheduled replacement after N_cycles or upon trending leak-rate increase.
Summary (conclusion & call to action)
- Specify measurable flow and leak metrics for UQD Quick Disconnects to translate connector performance into pump margin and thermal capacity requirements; require sample-based verification during procurement.
- Adopt a repeatable test protocol combining steady-state flow sweeps and complementary leak methods to report Cv, ΔP, and leak metrics with 95% CI so teams can compare batches objectively.
- Include explicit cycle-life and disconnect-loss requirements in contracts, and implement a field verification checklist to catch assembly or contamination issues before deployment.
FAQ
What is the best method to measure UQD Quick Disconnect flow performance?
Use steady-state flow sweeps across the expected operating range, measure upstream and downstream ΔP with calibrated transducers, and compute Cv. Record temperature to correct for viscosity; report median Cv with IQR and 95% CI for replicates to support acceptance decisions.
How should leak metrics be specified for field use?
Specify leak in mL per minute (or pressure-decay equivalent) at a defined pressure and temperature, plus disconnect-spill in mL per disconnect. Require both initial and post-cycle leak measurements and define acceptance thresholds and sampling plans in the procurement spec.
How often should UQD connectors be inspected or replaced in service?
Establish preventive maintenance intervals based on measured cycle life and observed leak-rate trends; common practice is periodic inspection and leak checks after a defined number of disconnects (e.g., every 1,000 cycles) or sooner if leak metrics trend upward, with replacement triggered by exceeding specified thresholds.
Which seal materials are recommended for glycol and deionized water mixtures?
EPDM seals are standard for glycol-water mixtures due to chemical stability, while FKM or specialty fluoropolymers are selected for high-temperature stability. Always verify compatibility with deionized water arrays to prevent premature seal degradation.


