





Quantifying connector performance drives realistic link budgets and reliable system design: fiber capacity, insertion/return loss, and environmental ratings all change margin calculations and maintenance needs. This article uses the AV87-13J2AWN and its MT datasheet as a focus to show which performance metrics to extract, how to interpret them, and how to apply those figures in rugged, mission-critical designs. The goal is actionable guidance for engineers evaluating high‑density circular MT connectors.
Readers will find a structured checklist of datasheet fields, a worked example converting insertion loss into link budget impact, and procurement and field best practices. The writeup emphasizes neutral interpretation of datasheet numbers and gives rules‑of‑thumb for derating in real deployments to improve reliability and simplify vendor comparison.
1 — Product background: what AV87-13J2AWN represents (Background introduction)
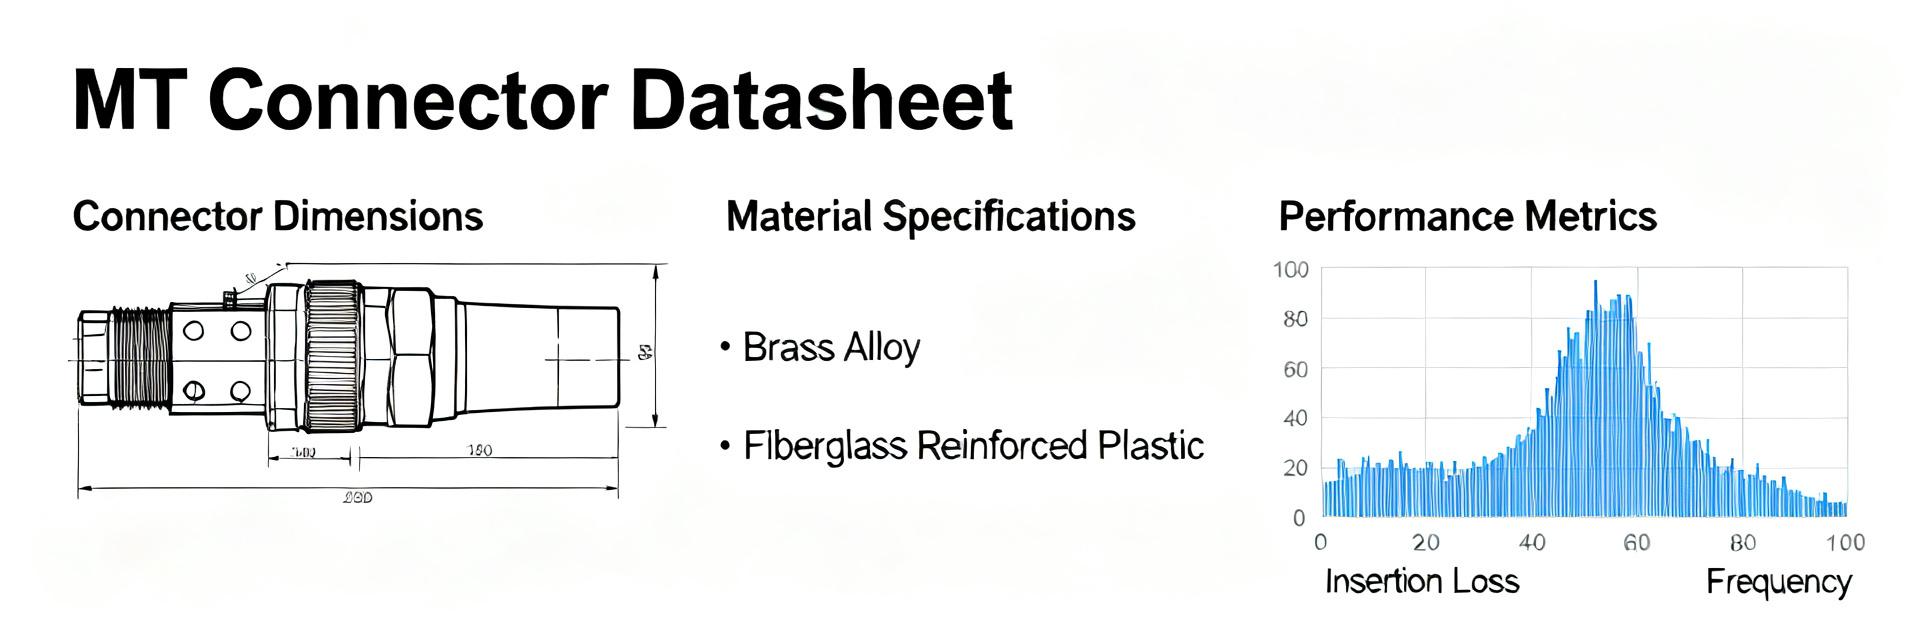
Connector family and intended applications
Point: The AV87-13J2AWN sits in a high‑density circular MT connector family designed for rugged environments. Evidence: Datasheets for this family generally show multi‑fiber MT ferrules within a small shell optimized for avionics and harsh telecom applications. Explanation: Engineers choose these parts for avionics, defense, and scientific systems where high fiber count, compact footprint, and mechanical robustness reduce system weight and cabling complexity.
Key physical & mechanical attributes to note
Point: Capture shell size, MT count per ferrule, total fiber capacity, mating style, materials, weight, and footprint. Evidence: These fields appear as discrete table entries on MT datasheets and determine rack density, strain relief needs, and mounting options. Explanation: Shell size and footprint dictate panel cutouts; fiber capacity and mating style determine assembly complexity; materials and weight impact thermal expansion and mechanical mounting strategy.
2 — Core optical performance metrics to extract and analyze (Data analysis)
Optical loss metrics: insertion loss, return loss, attenuation
Point: Key optical performance metrics are insertion loss (IL), return loss (RL), and fiber attenuation; extract typical and maximum values per MT or per fiber from the MT datasheet. Evidence: Datasheets commonly report typical IL (dB) and a maximum guaranteed IL, with test wavelength and fiber type noted. Explanation: Use the maximum IL for conservative budget planning and typical IL for production expectations; RL indicates back‑reflection sensitivity for coherent systems.
Optical margining & bandwidth/attenuation considerations
Point: Convert connector IL into link budget impact and combine it with fiber attenuation to set margins. Evidence: Example calculation uses a typical connector IL of 0.5 dB and worst‑case of 1.2 dB per connector (typical ranges); fiber attenuation example 0.35 dB/km (multimode/OM4) or 0.2 dB/km (single‑mode) as typical ranges. Explanation: Example calculation — for a run with two connectors (one plug, one receptacle) and 10 km of single‑mode fiber: connector loss = 2 × 0.6 dB (example typical) = 1.2 dB; fiber loss ≈ 10 km × 0.2 dB/km = 2.0 dB; total channel loss ≈ 3.2 dB. Add transmitter/receiver margins to verify system margin.
3 — Mechanical & environmental performance metrics (Data analysis / Method guide)
Durability, sealing, and mechanical ratings
Point: Prioritize mating cycles, IP ingress rating, shock & vibration specs, and torque limits for rugged applications. Evidence: The MT datasheet typically lists guaranteed mating cycles (e.g., 500–1000 cycles), an IP rating or sealing note, and shock/vibration test standards. Explanation: For airborne or mobile platforms, choose connectors with higher mating cycle guarantees and explicit vibration qualifications; an IP67 rating or equivalent is essential for wet or dusty environments.
Thermal and material limits
Point: Record operating/storage temperature ranges, material coefficients, and any derating guidance. Evidence: Datasheets show operating limits (example typical ranges: −40°C to +85°C) and material notes (metal shells, polymer ferrules). Explanation: Temperature affects IL and mechanical tolerances; plan for worst‑case thermal expansion and specify materials compatible with system environmental cycles to avoid long‑term drift or micro‑bending losses.
4 — How the datasheet tests are performed and how to interpret tolerances (Method guide)
Test conditions, references, and measurement setups
Point: Match test wavelengths, fiber type (SM/MM), and measurement method when comparing datasheets. Evidence: MT datasheets report test wavelengths (e.g., 850/1310 nm for MM, 1310/1550 nm for SM), reference fiber type, and whether IL is measured per fiber or per MT. Explanation: Comparing parts requires identical test conditions; a part rated at 0.5 dB IL at 850 nm multimode is not directly comparable to a single‑mode 1310 nm rating without conversion considerations.
Understanding tolerances and acceptance criteria
Point: Differentiate typical values from acceptance maxima and apply derating rules. Evidence: Datasheets present typical (mean) IL and a guaranteed maximum; manufacturers sometimes provide statistical tolerance bands. Explanation: Use guaranteed maximums for procurement acceptance; apply practical derating — e.g., add 0.5–1.0 dB for field splices, contamination, temperature drift, and aging to ensure long‑term margin in system budgets.
5 — Comparison, selection, and practical deployment considerations (Case study + Actionable)
Quick comparison checklist vs other high-density MT connectors
Point: Benchmark using a compact decision matrix of fiber count, IL/RL, IP/durability, shell size, weight, and termination complexity. Evidence: These metrics are the most decision‑driving items in MT datasheets and determine procurement tradeoffs. Explanation: Highlight fiber count per shell for density, guaranteed IL/RL for signal integrity, and IP/mating cycles for field longevity when ranking alternatives that comply with VITA 87 or similar standards.
| Metric | Recommended threshold (example) |
|---|---|
| Insertion loss (max, per connector) | <= 1.0 dB (industrial/avionics) |
| Return loss | >= 40 dB (single‑mode) / >= 20 dB (multimode) |
| Mating cycles | >= 500 cycles for field hardware |
| Ingress protection | IP67 or equivalent for outdoor/wet use |
Deployment recommendations & installation best practices
Point: Translate datasheet numbers into field steps: cleaning, mating sequence, and verification. Evidence: Best practices map directly to datasheet metrics—measure IL after mating, verify sealing after panel installation, and confirm torque/retention per mechanical spec. Explanation: Procurement and field teams should specify verified assemblies, require post‑install IL tests, schedule periodic inspection/cleaning, and maintain spares for high‑density ferrules to reduce downtime.
Summary (10–15% of article)
- Extract connector geometry and fiber capacity from the datasheet to assess panel density and mechanical fit; these physical attributes set system layout constraints and assembly needs, and influence weight and footprint tradeoffs for AV87-13J2AWN.
- Capture insertion loss, return loss, and test conditions from the MT datasheet; use guaranteed maximums for procurement acceptance and typical values for production expectations to compute link budgets.
- Prioritize environmental specs—mating cycles, IP rating, shock/vibration, and temperature ranges—to match expected field use; derate datasheet figures for splices, contamination, and thermal drift.
- Perform a worked link‑budget check using connector IL plus fiber attenuation and add conservative margins (0.5–1.0 dB) for field conditions prior to qualification testing.
FAQ — What performance metrics from an MT datasheet most directly affect link budget?
Insertion loss per connector and return loss are primary. Combined connector losses (two or more mating interfaces) plus fiber attenuation determine total channel loss. Use the datasheet's guaranteed maximum IL values in the budget and add conservatively for splices and contamination to maintain receiver margin.
FAQ — How should engineers interpret typical vs maximum values on an MT datasheet?
Typical values indicate expected production performance; maximums are contractual limits for acceptance. Engineers should design to maximums for procurement criteria and use typicals for manufacturing process control, plus add operational margins to cover environmental drift and handling variability.
FAQ — What field checks map to datasheet performance metrics after installation?
Measure insertion loss and continuity after mating, inspect ferrule faces for contamination, verify sealing and torque per mechanical spec, and log IL/RL results. Schedule periodic inspections based on mating cycles and environmental exposure to ensure continued compliance with datasheet performance metrics.
FAQ — How does operating temperature affect the optical performance of the AV87-13J2AWN?
Operating temperature extremes cause physical expansion and contraction of the polymer MT ferrule and metal shell. This thermal movement can induce micro-bending or minor alignment offsets, which elevate insertion loss. System designs must incorporate operating temperature margins to avoid long-term signal drift.


