





Point: In hyperscale and edge deployments, single‑phase liquid cooling is becoming the default for high‑density compute, increasing the need for precise connector specifications. Evidence: Industry specifications and consensus documents report rapid year‑over‑year adoption in thermal management architectures. Explanation: Engineers selecting quick disconnects must decode a UQD connector datasheet to ensure delivered flow rates and pressure margins meet system goals and reliability targets.
Point: This article decodes a UQD connector datasheet so engineers can read flow rates and pressure specs, compare options, and size systems correctly. Evidence: It synthesizes typical datasheet sections, common units, test conditions, and practical validation steps. Explanation: The goal is practical guidance—how to interpret rated vs tested flow, translate ΔP vs flow curves, and validate working, proof, and burst pressure claims for robust pump and plumbing selection.
UQD standard & datasheet overview
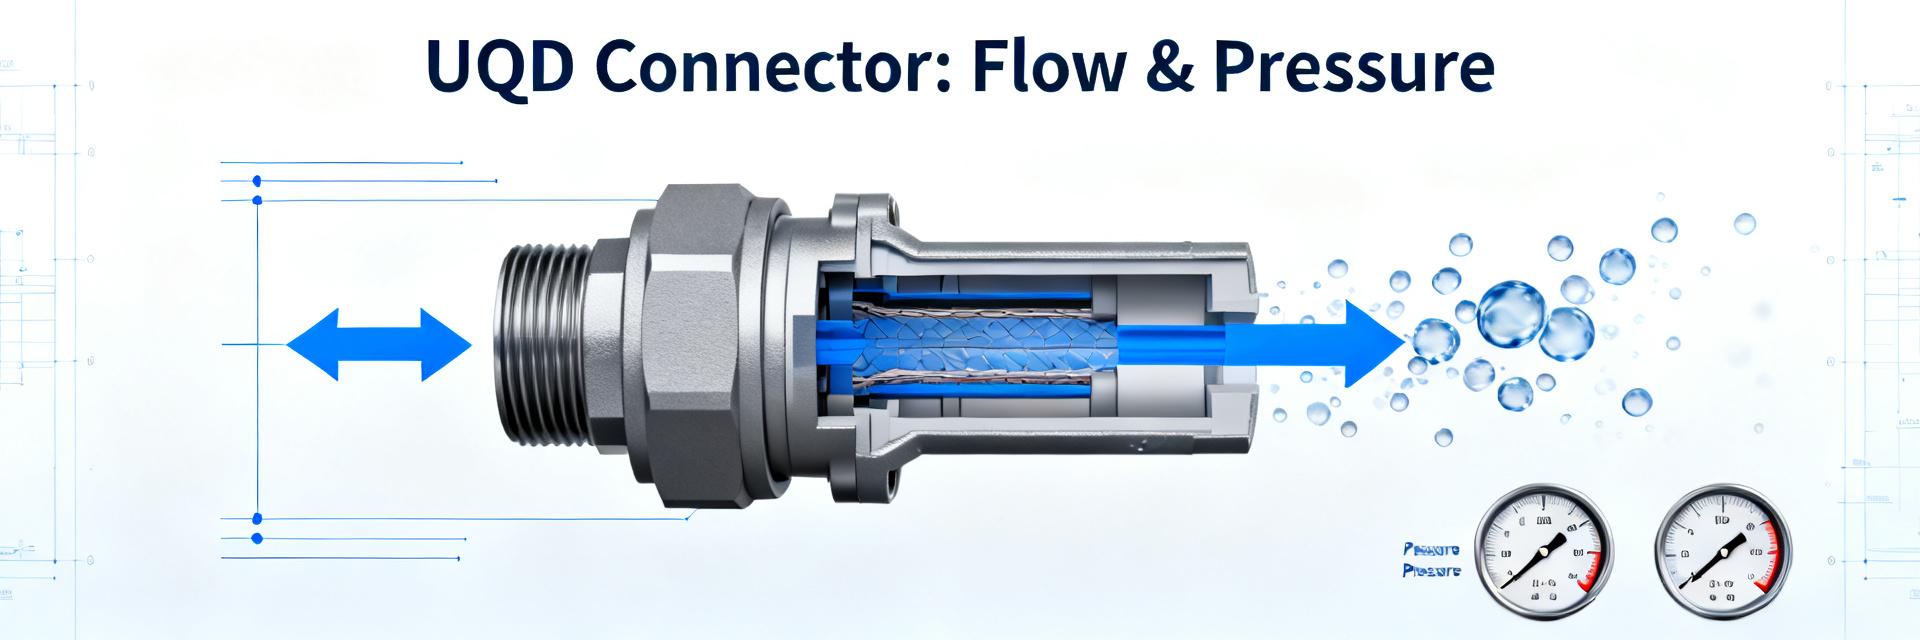
What “UQD” specifies on a datasheet
Point: A typical UQD datasheet lists mechanical, hydraulic, thermal, and lifecycle attributes that determine suitability. Evidence: Common entries include mechanical dimensions, rated flow, max working pressure, burst/proof pressure, leak‑before‑disconnect or dry‑break behavior, operating temperature range, materials, hose barb/hose interface, and coupling/un‑coupling forces. Explanation: Understanding terms such as working (continuous) pressure versus proof or burst pressure is essential to apply appropriate safety margins and to size pumps and relief systems.
Common units and notations to watch
Point: Unit conventions vary and must be converted correctly. Evidence: Flow is commonly given in L/min (LPM) or GPM; pressure in bar or psi; temperature in °C/°F; test conditions list fluid type, viscosity, and temperature. Explanation: For US systems prefer psi and °F first with SI in parentheses—e.g., 100 psi (6.9 bar). Confirm whether flow/ΔP tests used water at 68 °F (20 °C) or a glycol/water mix, as fluid properties change results significantly.
Flow rates: rated, tested, and real‑world expectations
Rated vs. tested flow rates on the datasheet
Point: Datasheets often present a “rated” flow and a measured ΔP vs flow curve from a test rig. Evidence: Rated flow is a nominal performance target while test curves show measured pressure drop (ΔP) across the coupling at incremental flows under defined conditions. Explanation: Engineers must read the ΔP vs flow plot or Cv/Kv value to predict connector head loss at a design flow; rated flow alone can be misleading without ΔP or allowable pressure‑drop data.
How viscosity, temperature, and system layout affect delivered flow
Point: Fluid viscosity, temperature, hose ID/length, and number of couplings determine delivered flow more than the connector’s nominal rating. Evidence: Glycol mixtures at low temperature raise viscosity and multiply head loss; each coupling introduces incremental loss. Explanation: Use conservative rules of thumb—expect several percent additional head loss per coupling and increased head loss per meter of small‑ID hose—then verify with manufacturer ΔP curves or bench testing before committing pump sizing.
Pressure specifications: working, proof, burst, and leakage
Interpreting working pressure and safety margins
Point: Working pressure on a datasheet denotes maximum continuous service pressure. Evidence: Vendors often publish a working (rated) pressure and a separate burst or proof number. Explanation: Designers should apply a prudent safety margin (commonly 20–50% below rated working pressure for continuous service) to account for pressure spikes, thermal transients, and water hammer; select pumps and relief devices so nominal system pressure stays within margin.
Burst/proof tests and leak behavior (what datasheets mean by “no spillage”)
Point: Proof and burst tests establish structural limits; leak‑before‑burst and “dry‑break” claims describe failure and disconnection behavior. Evidence: Datasheets may report proof test (typically 1.5× working pressure) and burst test values, plus measured leakage rates under test medium and cycle counts. Explanation: Ask vendors for test protocols—test medium, temperature, and cycle count—because “no spillage” often means controlled internal valving during disconnect at specified test conditions, not absolute zero leakage under all conditions.
Case examples & sample calculations
Sample calculation: sizing a UQD for target flow and allowable ΔP
Point: Use ΔP vs flow (or Cv/Kv) to confirm connector suitability for a design flow. Evidence: Given design flow Q = 6.0 L/min (1.59 GPM) and allowable ΔP across connector = 2 psi (0.14 bar), consult a ΔP vs Q table or Cv. Explanation: If datasheet lists Cv = 1.2, then ΔP (psi) ≈ (Q / (Cv))^2, so ΔP ≈ (1.59/1.2)^2 ≈ 1.76 psi, acceptable under 2 psi limit. Verify unit conversions when using Kv/Cv and account for fluid viscosity differences from water.
| Flow (GPM) | Flow (L/min) | ΔP (psi) |
|---|---|---|
| 0.5 | 1.9 | 0.12 |
| 1.0 | 3.8 | 0.48 |
| 1.6 | 6.1 | 1.8 |
| 2.0 | 7.6 | 3.6 |
Typical application scenarios and expected datasheet ranges
Point: Different applications target different flow and pressure ranges. Evidence: Typical single cold‑plate connections aim for 0.5–2.0 GPM (1.9–7.6 L/min) and working pressures of 50–150 psi (3.4–10.3 bar); manifold or blade quick disconnects may target higher flows and similar or higher working pressures. Explanation: Use scenario ranges to shortlist candidate connectors, then confirm with ΔP curves and cycle/temperature ratings appropriate to the duty.
How to validate datasheet claims: testing, selection checklist & installation tips
Pre‑purchase checklist for comparing datasheets
Point: A focused checklist reduces selection risk. Evidence: Verify test conditions (fluid, temp), request ΔP vs flow curves, confirm proof/burst protocols, ask for cycle life and leakage rates, confirm mating compatibility and keyed options, and verify materials for fluid compatibility. Explanation: Where possible obtain raw test data and ask vendors to run your specific fluid and temperature to produce ΔP curves so comparisons are apples‑to‑apples.
Onsite validation: simple lab tests and installation best practices
Point: Quick onsite tests detect gross mismatches before deployment. Evidence: Bench ΔP vs flow tests, leak tests under pressure and thermal cycling, and coupling/un‑coupling force checks are practical. Explanation: Install with correct hose retention and barb torque, orient couplings per manufacturer guidance, purge and drain carefully, and follow contamination‑control practices to avoid particulate dead zones; document results for field acceptance.
Summary (10–15% of article)
- Read a UQD connector datasheet by checking rated flow, ΔP vs flow curves, and working/burst pressures—use Cv/Kv or ΔP plots to predict real delivered flow and head loss for your system.
- Account for fluid viscosity, temperature, hose ID/length, and number of couplings—these often dominate flow rates and can increase head loss by a conservative margin compared with datasheet water tests.
- Validate pressure claims by requesting proof/burst test protocols and cycle data; apply a safety margin below working pressure when specifying pumps and relief devices.
- Perform bench ΔP vs flow and leak tests with your fluid and temperatures, and follow installation best practices (hose retention, purge/drain, orientation) for reliable operation.
FAQ
How does a UQD connector affect system flow rates?
Point: Each UQD contributes pressure drop that reduces delivered flow. Evidence: Datasheet ΔP vs flow curves or Cv values quantify that loss; small‑ID lines and low temperatures (higher viscosity) increase it. Explanation: Use ΔP curves to predict head loss at design flow, apply unit conversions as needed, and include coupling losses in pump head calculations to ensure target flow is delivered under operating conditions.
What working pressure should I choose for a UQD connector?
Point: Select a working pressure above normal system pressure with margin. Evidence: Datasheets give working and burst/proof pressures; transient events and thermal expansion can spike pressures. Explanation: Common practice is to design nominal system pressure to be 20–50% below rated working pressure and ensure relief devices or expansion controls are in place to protect connectors from transient overpressure.
Can I rely on “no spillage” claims on a datasheet for dry‑break behavior?
Point: “No spillage” often reflects specific test conditions and valving design. Evidence: Datasheets typically state test medium, temperature, and cycle counts used to verify dry‑break or leak‑before‑disconnect behavior. Explanation: Confirm vendor test protocols and request demonstrations or raw data under your expected fluid and temperature; plan for controlled disconnect procedures during maintenance to minimize risk.
Why is it important to distinguish between rated and tested flow rates?
Rated flow is a nominal performance target, while test curves show measured pressure drop (ΔP) across the coupling at incremental flows. Engineers must read the ΔP vs flow plot or Cv/Kv value to predict connector head loss at a design flow; rated flow alone can be misleading without ΔP or allowable pressure-drop data.


