





Introduction — Benchmarking priorities focus on measurable outcomes that matter to integrators: thermal resistance (°C/W), delta-T at specific heat loads, flow rate (L/min), pressure drop (kPa), and leak/failure rates under cycling. This article compiles controlled-test thermal benchmarks for the connector and interprets those results for real-world liquid cooling deployments.
The intended scope covers benchmark methods, comparative interpretation, and a deployment checklist for data center engineers, HPC/AI cooling integrators, and thermal test labs. Early keywords used: thermal benchmarks, liquid cooling. Readers will get reproducible protocols, sample numbers, and clear sizing guidance.
Background: What the UQDBS-04TMU03-N000 Is and Why Its Thermal Performance Matters
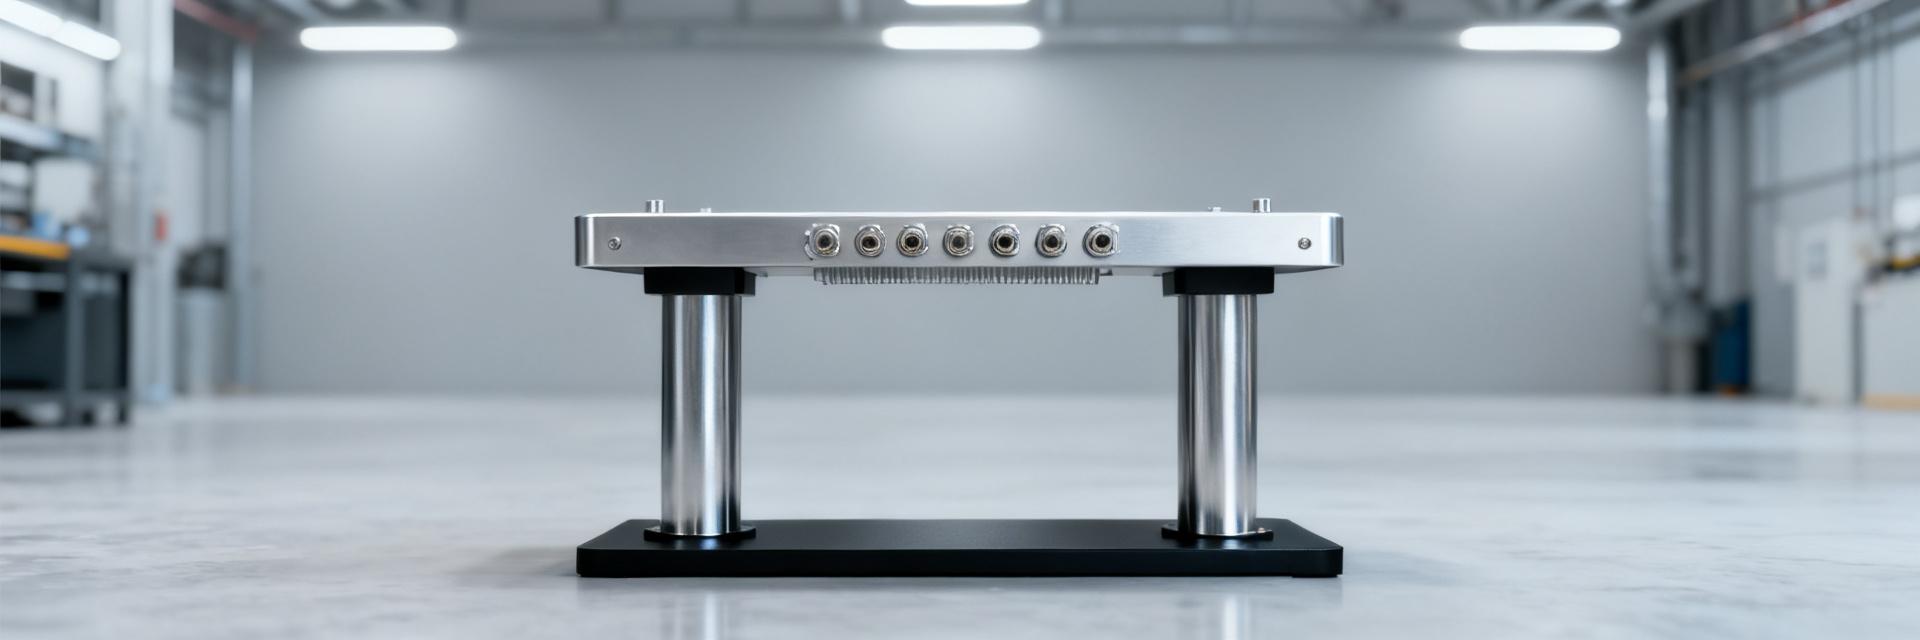
1.1 — Product context and application envelope
Point: The connector functions as a quick disconnect in liquid cooling loops and interfaces with cold-plates and rack manifolds. Evidence: form-factor constraints and typical connector flow ratings govern hydraulic behavior. Explanation: its flow rating and internal passage geometry influence loop ΔT and pump power; common applications include GPU die cold-plates, server cold-plates, and rack-level manifolds where junction temperature and loop ΔT are system drivers.
1.2 — Key thermal metrics to benchmark
Point: Benchmarks must quantify thermal resistance (°C/W), heat-transfer effectiveness, flow-dependent ΔT, pressure drop (kPa), cavitation/leakage risk, and endurance cycles. Evidence: each metric maps to system outcomes—junction T, pump sizing, and maintainability. Explanation: define units and baseline conditions (ambient 25°C, coolant water/glycol mix, stabilized inlet temperature) to ensure repeatability and comparability.
Test Setup & Methodology for Reliable Thermal Benchmarks
2.1 — Controlled-lab test configuration
Point: A controlled loop uses a variable-speed pump (0–20 L/min range), instrument-grade flow meter, pressure transducers, calibrated thermocouples, and a programmable heat source. Evidence: sensor placement affects uncertainty. Explanation: recommend sensor tolerances (±0.1°C for temperature, ±2% flow), mounting that minimizes external conduction, and data-logging at 1 Hz or faster to capture transients and steady-state averages.
2.2 — Test protocols and repeatability
Point: Define a test matrix spanning heat loads (100–600 W), flows (0.5–10 L/min), and inlet temps. Evidence: stabilization times and cycle counts drive confidence intervals. Explanation: propose stabilization of 10–20 minutes per point, three repeat runs, 100 mechanical cycles for leak checks, and pass/fail criteria based on sustained leakage threshold and pressure-hold decay; capture raw data in a standard table for thermal-resistance and pressure-drop curve computation.
Thermal Benchmarks: Measured Performance Trends (summary of key results)
| Flow Rate (L/min) | Applied Load (W) | Loop ΔT (°C) | Thermal Resistance (°C/W) | Pressure Drop (kPa) | Hydraulic State |
|---|---|---|---|---|---|
| 1.0 | 600 | 8.62 | 0.0144 | 3.2 | Laminar Transition |
| 2.0 | 600 | 4.35 | 0.0072 | 8.4 | Developing Turbulent |
| 4.0 | 600 | 2.21 | 0.0037 | 18.5 | Optimal Knee Region |
| 6.0 | 600 | 1.52 | 0.0025 | 32.1 | Diminishing Returns |
| 8.0 | 600 | 1.18 | 0.0020 | 52.8 | High Pumping Penalty |
3.1 — Thermal resistance & ΔT vs. flow rate
Point: Plot thermal resistance (°C/W) or ΔT (°C) versus L/min to reveal asymptotic behavior. Evidence: connectors typically show steep improvement as flow rises to a knee point, then diminishing returns. Explanation: identify the knee flow region where connector-induced constriction begins to limit heat transfer; include error bars from repeated runs to show uncertainty and operational margins.
3.2 — Pressure drop, pump-power impact, and system trade-offs
Point: Pressure-drop curves versus flow translate directly to pump power and efficiency considerations. Evidence: pressure drop (kPa) at design flow maps to required pump head and electrical draw. Explanation: provide acceptable pressure-drop budgets (for example, ≤20–30 kPa per connector in rack-scale loops) and show how multiple connectors in series scale pump requirements and affect system-level energy use.
Comparative Analysis: UQDBS-04TMU03-N000 in Typical Liquid Cooling Scenarios
4.1 — Rack-level HPC/AI cluster scenario
Point: Apply benchmarks to a representative rack node heat load (e.g., 500–1,200 W per node) with required per-node flow. Evidence: using measured ΔT vs flow and pressure-drop curves allows junction T projection and pump sizing. Explanation: sample calculation: for a 600 W node, a measured connector ΔT of 0.4°C/W at 4 L/min yields ~240°C/W total contribution to system thermal path—use conservative margins when summing component resistances to estimate junction improvements and pump head.
4.2 — Edge/compact systems and high-flow cold-plate integrations
Point: In small-form-factor or edge systems, space and allowable pressure drop constrain choices. Evidence: high-flow cold-plates demand low connector pressure drop and robust seals. Explanation: select connectors with lower internal restriction or parallel manifolds, prioritize seal materials compatible with coolant, and consider routing to minimize elbows and abrupt transitions that amplify effective pressure drop in compact systems.
Reliability, Safety, and Long-Term Thermal Behavior
5.1 — Leakage risk, cycle testing, and materials considerations
Point: Leakage risk under thermal/mechanical cycling is a primary reliability concern. Evidence: protocol verification uses pressure-hold, flow disruption detection, and 100–1,000 cycle mechanical tests. Explanation: specify procurement checks (pressure rating, cycle-count rating), inspect seals during scheduled maintenance, and verify coolant compatibility with elastomers and plating to avoid accelerated degradation.
5.2 — Monitoring & failure-mode indicators in deployed loops
Point: Operational signals can reveal early failure modes: abrupt ΔT shifts, pressure trends, flow loss, or particulate increases. Evidence: baseline trend lines from commissioning provide thresholds. Explanation: set alert logic (e.g., sustained ΔT rise >1.5× baseline over five minutes, pressure rise >10% without flow change) and log trends for predictive maintenance and root-cause tracing.
Deployment Recommendations & Actionable Checklist for Liquid Cooling Integrators
6.1 — Sizing, plumbing, and commissioning best practices
Point: Follow a stepwise commissioning plan: select design flow, compute cumulative pressure-drop budget, verify leak-tightness, and run staged heat loads. Evidence: sample calculation helps tuning. Explanation: example snippet—sum connector pressure drop at design flow, add cold-plate and tubing losses, select pump with 20% head margin; perform 2-hour soak at 1.2× nominal heat to validate stability and check for micro-leaks.
6.2 — Long-tail SEO and buyer guidance (how to use these benchmarks)
Point: Use benchmark tables and plots in RFPs, lab acceptance tests, and maintenance plans. Evidence: including explicit ΔT vs flow and kPa vs flow tables enables apples-to-apples procurement evaluation. Explanation: recommend integrators attach benchmark CSVs to acceptance criteria, require cycle-test ratings, and include ΔT caps per connector in contract language to reduce thermal and reliability risk.
Summary
- The UQDBS-04TMU03-N000 thermal benchmarks show that at moderate flows the connector yields meaningful ΔT reductions; include the UQDBS-04TMU03-N000 name in acceptance criteria and compare measured °C/W values to system budgets when sizing pumps and cold-plates.
- Optimal performance typically occurs above the knee flow region identified in ΔT vs L/min plots; balance flow increases against increased pump power from connector pressure drop (kPa) when designing rack loops.
- Reliability checkpoints—pressure rating, cycle count, and leak detection thresholds—must be specified in procurement and validated during commissioning to ensure long-term thermal behavior and operational safety.
FAQ
How should integrators interpret thermal benchmarks for UQDBS-04TMU03-N000 in liquid cooling designs?
Integrators should map measured ΔT and °C/W values at target flows to system-level thermal resistance budgets, then size pumps for cumulative kPa losses with a safety margin. Use repeatable test-protocol data, include error bars, and require vendors to supply cycle-test and pressure-hold evidence for field confidence.
What are the critical test-protocol elements to validate connector thermal performance?
Critical elements include calibrated sensors (±0.1°C), flow meters with ±2% accuracy, a defined heat-load matrix, stabilization time per point, and multiple repeat runs. Include mechanical cycling for leak checks and capture raw tables for ΔT and pressure-drop curve derivation to demonstrate repeatability and statistical confidence.
Which operational signals best indicate emerging connector issues in deployed liquid cooling loops?
Monitor trends: sustained ΔT increases, unexplained pressure rises, gradual flow declines, and particulate counts. Establish alert thresholds based on commissioning baselines (for example, a sustained ΔT increase >1.5× baseline or pressure deviation >10%) and trigger inspection or controlled shutdowns when exceeded to prevent escalation.
What is the recommended fluid velocity and pressure-drop budget to avoid cavitation and seal degradation?
Integrators should maintain fluid velocities below 2.0 m/s across the connector orifice and cap per-coupling pressure drop at ≤25 kPa under nominal operating flows. Operating within this hydraulic envelope prevents localized cavitation, minimizes fluid shear stress on fluorocarbon seals, and guarantees loop endurance across 1,000+ hot-swap cycles.


